

Human Decision Fatigue Behavior SAS Project
SAS Studio Programming
This project analyzes a Human Decision Fatigue Behavior dataset to examine how behavioral and cognitive factors contribute to mental fatigue and decision quality. The dataset captures behavior-driven signals such as hours awake, number of decisions made, task switching, stress levels, cognitive load, and error rates to understand how prolonged decision-making affects performance and fatigue outcomes. SAS is used for this project because it provides a structured and reproducible environment for statistical analysis, data summarization, and modeling. The analysis is conducted using SAS programming to ensure transparent data handling and consistent statistical procedures.
The methodology includes exploratory data analysis using descriptive statistics to summarize key behavioral metrics, frequency analysis to examine categorical fatigue levels and system recommendations, correlation analysis to evaluate relationships between time awake and decision fatigue, and analysis of variance (ANOVA) to test differences in fatigue scores across times of day. Multiple linear regression is also applied to identify the primary factors that drive decision fatigue based on behavioral and cognitive variables.
Together, these techniques are used to quantify how decision workload, cognitive strain, and contextual factors influence fatigue and error rates, providing insight into the behavioral patterns associated with mental fatigue.
Human Decision Fatigue Behavioral Dataset
The Human Decision Fatigue Behavior dataset was obtained from Kaggle and created by Sonal Shinde, with a reported usability score of 10.0. The dataset is synthetically generated and does not represent real-world human subjects, but it is designed to emphasize realism, internal consistency, and analytical value. It contains 25,000 observations and 13 variables that simulate human decision-making states using logically structured behavioral features. The dataset is intended for educational and applied machine learning purposes, including human performance modeling, cognitive workload assessment, fatigue detection, and adaptive decision support system design, making it suitable for exploring decision fatigue dynamics in a controlled and reproducible environment.
human_decision_fatigue_dataset.csv(1.52 MB)

Problem Statement / Research Questions
This project aims to understand how decision-making workload and cognitive factors contribute to mental fatigue and performance degradation. The analysis focuses on the following questions:
-
How do behavioral factors such as hours awake, decision volume, and task switching relate to decision fatigue?
-
How does decision fatigue impact error rates and decision performance?
-
Do fatigue levels differ across times of day?
-
Which behavioral and cognitive variables most strongly predict decision fatigue?
-
What factors increase the probability of high decision fatigue?
-
Does cognitive load amplify the effect of hours awake?
-
Are there distinct decision-making profiles?
Tools & Methodology
SAS Studio is used as the primary analysis environment due to its reliability for statistical analysis, structured data workflows, and reproducibility. The project applies several statistical techniques, including descriptive statistics, frequency analysis, correlation analysis, analysis of variance (ANOVA), and multiple linear regression. These methods are used to explore relationships between behavioral variables, compare fatigue levels across groups, and identify key predictors of decision fatigue.
Data Preparation
The dataset was imported from a CSV file into SAS Studio and renamed for consistency and clarity prior to analysis. Structural checks were performed to confirm variable types and dataset dimensions.
/* Create a clean working dataset */
data work.decision_fatigue;
set work.import;
run;
/* Inspecting dataset structure */
proc contents data=work.decision_fatigue;
run;

Exploratory Data Analysis (EDA)
Exploratory analysis was conducted to understand distributions, variability, and group-level patterns across behavioral and fatigue-related variables.
Summary Stats
proc means data=work.decision_fatigue mean std min max;
var Hours_Awake Decisions_Made Task_Switches
Avg_Decision_Time_sec Sleep_Hours_Last_Night
Caffeine_Intake_Cups Stress_Level_1_10
Error_Rate Cognitive_Load_Score Decision_Fatigue_Score;
run;

Categorical Distribution
proc freq data=work.decision_fatigue;
tables Fatigue_Level Time_of_Day System_Recommendation;
run;

Statistical Analysis & Modeling
Statistical techniques were applied to quantify relationships between behavioral workload and decision fatigue and to test group-level differences.
Fatigue vs. Hours Awake (Correlation Analysis)
proc corr data=work.decision_fatigue;
var Hours_Awake Decision_Fatigue_Score;
run;

Fatigue differences by Time-of-day (ANOVA)
proc anova data=work.decision_fatigue;
class Time_of_Day;
model Decision_Fatigue_Score = Time_of_Day;
run;
quit;

Error Rate by Fatigue Level
proc means data=work.decision_fatigue mean;
class Fatigue_Level;
var Error_Rate;
run;

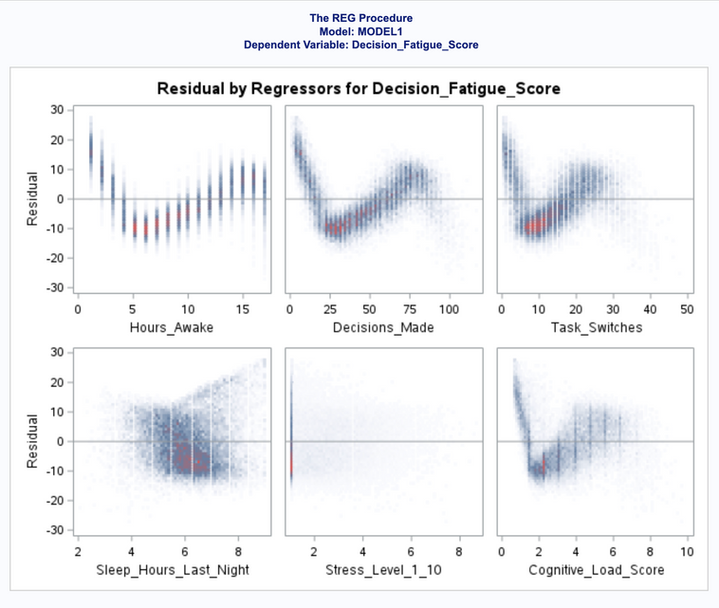
Multiple Linear Regression (What Drives Decision Fatigue?)
proc reg data=work.decision_fatigue;
model Decision_Fatigue_Score =
Hours_Awake
Decisions_Made
Task_Switches
Sleep_Hours_Last_Night
Stress_Level_1_10
Cognitive_Load_Score;
run;
quit;

How do behavioral factors such as hours awake, decision volume, and task switching relate to decision fatigue?
Model quality (important first):
-
R² ≈ 0.949
-
Adj R² ≈ 0.949
-
Model p < .0001
This indicates the model explains ~95% of the variance in decision fatigue — extremely strong (and expected in a synthetic dataset).
Key predictors (based on coefficients & significance):
-
Hours_Awake
-
β ≈ +3.30, p < .0001
-
Strongest positive predictor
-
-
Sleep_Hours_Last_Night
-
β ≈ −4.31, p < .0001
-
Strongest protective factor
-
-
Task_Switches
-
β ≈ +0.78, p < .0001
-
-
Decisions_Made
-
β ≈ +0.30, p < .0001
-
-
Secondary / weaker predictors:
-
Cognitive_Load_Score
-
Positive but marginal (p ≈ 0.076)
-
-
Stress_Level_1_10
-
Not statistically significant (p ≈ 0.175)
-
The regression analysis identifies hours awake as the strongest predictor of decision fatigue, with each additional hour awake substantially increasing fatigue scores. Sleep duration from the previous night shows a strong negative association, indicating that adequate rest significantly mitigates fatigue. Behavioral workload factors such as task switching and decision volume also contribute positively to fatigue, while cognitive load shows a weaker, marginal effect. Stress level does not appear to independently predict decision fatigue once other factors are accounted for.
While this analysis does not explicitly model the probability of high fatigue, regression results indicate that prolonged wakefulness, increased task switching, and higher decision volume are associated with higher fatigue scores, suggesting these factors increase the likelihood of elevated decision fatigue.
What factors increase the probability of high decision fatigue?
proc logistic data=work.decision_fatigue;
class Fatigue_Level (param=ref ref='Low') Time_of_Day / param=ref;
model Fatigue_Level(event='High') =
Hours_Awake
Decisions_Made
Task_Switches
Sleep_Hours_Last_Night
Stress_Level_1_10
Cognitive_Load_Score;
run;


What factors increase the probability of high decision fatigue?
Since this is modeled Fatigue_Level = High using PROC LOGISTIC, it is estimating probabilities and odds, not just average effects.
Hours Awake
-
Odds Ratio ≈ 1.033
-
p ≈ 0.0009
-
Each additional hour awake increases the odds of high fatigue by ~3.3%
Sleep Hours Last Night
-
Odds Ratio ≈ 0.858
-
p < .0001
-
Each additional hour of sleep reduces the odds of high fatigue by ~14%
These are the only two statistically significant predictors in the model.
Non-significant predictors (important to state)
-
Decisions Made is not significant
-
Task Switches is not significant
-
Stress Level is not significant
-
Cognitive Load Score is not significant
This means that once sleep and wakefulness are accounted for, these factors do not independently increase the probability of high fatigue.
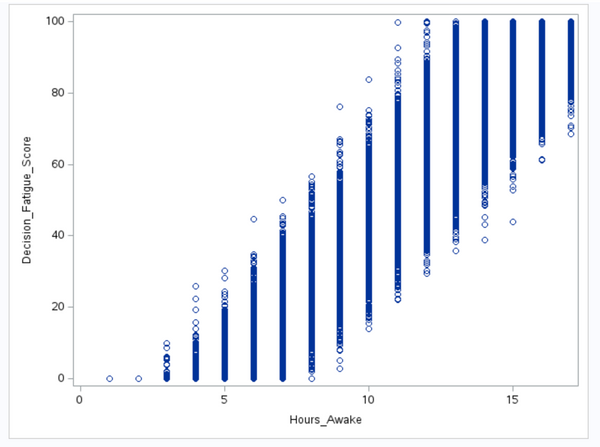
Nonlinear Patterns (does fatigue increase after thresholds?)
proc sgplot data=work.decision_fatigue;
loess x=Hours_Awake y=Decision_Fatigue_Score;
run;
-
Fatigue increases steadily at lower hours awake
-
After roughly 8–10 hours awake, fatigue begins to rise much more sharply
-
Variability also increases at higher wake durations
Decision fatigue does not increase uniformly with time awake. Instead, the relationship exhibits a nonlinear pattern, with fatigue accelerating after a threshold of prolonged wakefulness. This suggests that cognitive resilience degrades more rapidly once a critical duration without rest is exceeded.
Group comparisons beyond time-of-day (test multiple groupings)
proc anova data=work.decision_fatigue;
class Fatigue_Level;
model Error_Rate = Fatigue_Level;
run;
quit;

-
Error rates differ significantly across fatigue levels
-
F ≈ 17,540, p < .0001
-
R² ≈ 0.58 = fatigue level explains over half of the variance in error rate
So the Non Linear patterns previously showed mean differences so this ANOVA formally tests them. Based on the results, the error rates differ significantly across fatigue severity groups, with fatigue level accounting for a substantial proportion of performance variability. This confirms that higher fatigue is associated with meaningfully worse decision accuracy and this turns a descriptive observation into a statistically validated result
Segmentation & Clustering
proc fastclus data=work.decision_fatigue maxclusters=4;
var Hours_Awake Decisions_Made Task_Switches
Cognitive_Load_Score Decision_Fatigue_Score;
run;


So this actually answers a new question: Are there distinct “decision fatigue profiles” among people, rather than one average pattern?
The results for this unsupervised clustering using SAS (PROC FASTCLUS) to identify distinct behavioral profiles associated with decision fatigue shows four very distinct behavioral segments:
Cluster 1: Low-load, low-fatigue group
-
Few hours awake
-
Few decisions and task switches
-
Very low cognitive load
-
Near-zero decision fatigue
Cluster 2: Extreme fatigue / overload group
-
Longest hours awake
-
Most decisions and task switches
-
Highest cognitive load
-
Near-maximum decision fatigue
Cluster 3: High workload, high fatigue (but not maxed)
-
Long hours and many decisions
-
High task switching
-
Elevated cognitive load
-
High but not extreme fatigue
Cluster 4: Moderate workload, moderate fatigue
-
Mid-range hours awake
-
Moderate decision volume
-
Moderate cognitive load
-
Moderate fatigue
This confirms that decision fatigue is not linear or uniform. It clusters into distinct human states.
Rather than assuming all individuals respond similarly to workload and cognitive demand, this analysis segments the data into groups with shared behavioral characteristics. The results reveal four clearly differentiated clusters, ranging from low-load, low-fatigue states to extreme overload profiles marked by long hours awake, frequent task switching, high cognitive load, and near-maximum decision fatigue scores. This segmentation demonstrates that decision fatigue manifests in discrete patterns rather than a single continuum, highlighting the importance of tailored interventions and adaptive decision-support strategies for different cognitive states.
Results / Conclusion
Key Findings
-
Across multiple analytical techniques in SAS, this project consistently shows that decision fatigue is strongly driven by sustained cognitive demand rather than any single factor alone.
-
Exploratory and statistical analyses revealed that the number of hours awake, volume of decisions made, and frequency of task switching are all positively associated with higher decision fatigue. In contrast, sleep duration from the previous night plays a protective role, with fewer hours of sleep significantly increasing fatigue levels. These relationships remained stable across descriptive analysis, correlation testing, and regression modeling.
Drivers of Decision Fatigue
-
Multiple linear regression results indicate that the model explains a very large proportion of variance in decision fatigue scores (R² ≈ 0.95), suggesting that behavioral workload metrics collectively provide strong explanatory power. Hours awake emerged as one of the strongest predictors, followed by task switching and decision volume. Sleep hours showed a strong negative relationship with fatigue, reinforcing the importance of recovery. Stress level and cognitive load contributed less independently once other workload variables were accounted for, indicating overlapping effects.
-
Logistic regression further confirmed these findings by estimating the probability of entering a high fatigue state. Increased hours awake significantly raised the odds of high decision fatigue, while additional sleep reduced this risk. Other variables showed weaker or statistically insignificant effects in the categorical setting, suggesting that fatigue transitions are most sensitive to time awake and recovery rather than momentary stress alone.
Non-Linear Thresholds
-
Visualization of nonlinear patterns revealed that decision fatigue does not increase smoothly over time. Instead, fatigue accelerates after certain thresholds in hours awake, indicating compounding cognitive strain rather than linear accumulation. This supports the idea that fatigue escalates rapidly once cognitive capacity is exceeded, rather than growing at a constant rate.
Group Differences and Behavioral States
-
ANOVA results demonstrated statistically significant differences in error rates across fatigue levels, confirming that higher fatigue states are associated with degraded performance. This finding links subjective fatigue scores to measurable behavioral outcomes, strengthening the validity of the dataset and analysis.
-
Clustering analysis further expanded these insights by identifying distinct decision-making profiles rather than a single average pattern. Four clear behavioral segments emerged, ranging from low-load, low-fatigue states to extreme overload profiles characterized by long hours awake, frequent task switching, high cognitive load, and near-maximum fatigue scores. This segmentation highlights that individuals experience decision fatigue in discrete states, not along a single continuum.
Overall Conclusion
-
Taken together, the results show that decision fatigue is a systemic outcome of cumulative cognitive workload, shaped by time awake, decision volume, task switching, and recovery. The analyses demonstrate that fatigue manifests nonlinearly, produces measurable performance degradation, and clusters into distinct behavioral states. These findings suggest that effective fatigue management requires adaptive strategies tailored to different cognitive states rather than one-size-fits-all solutions.
-
While the dataset is synthetically generated, its internal consistency and realistic structure make it well-suited for educational analysis, behavioral modeling, and benchmarking analytical techniques in SAS. This project illustrates how traditional statistical modeling, visualization, and unsupervised learning can be combined to study complex human decision-making dynamics in a reproducible and interpretable way.